
Sorry, this activity is currently hidden
Section outline
-
Introduction
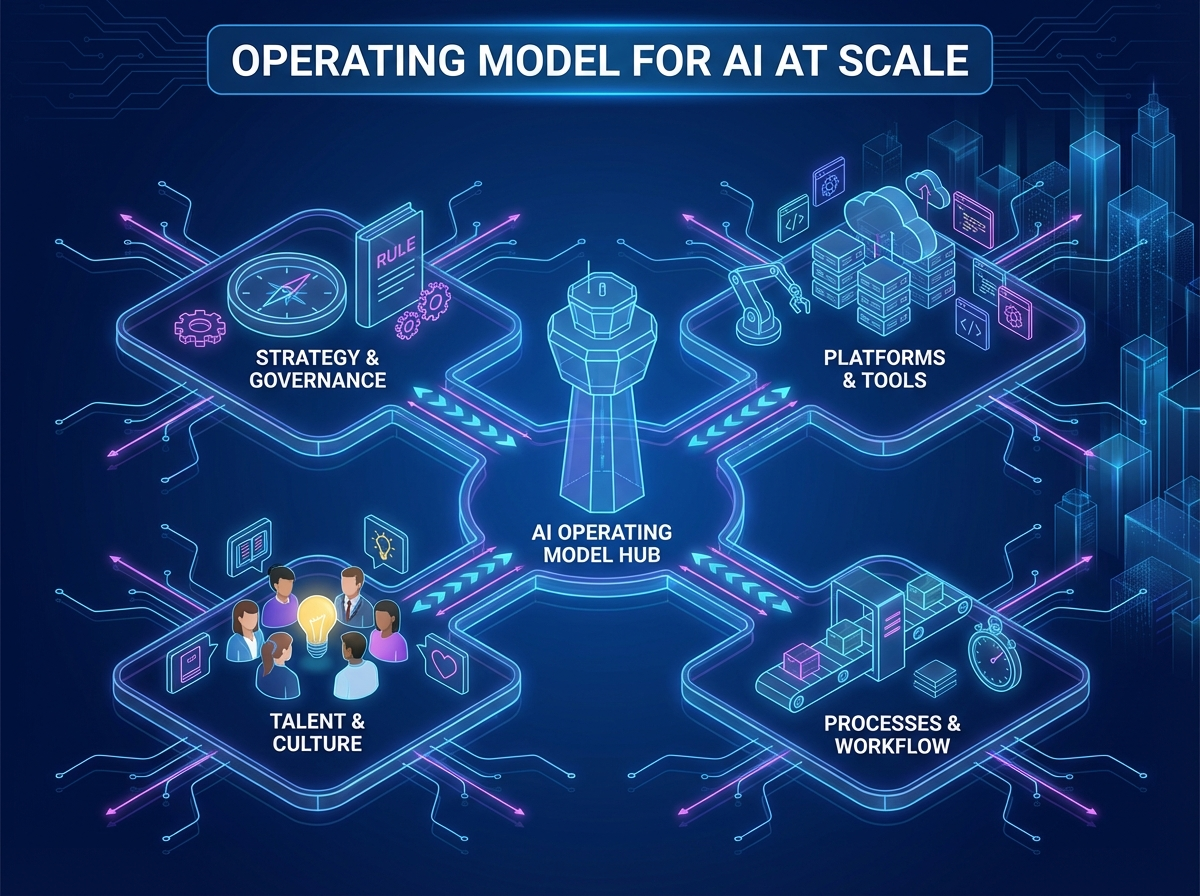
Scaling AI beyond pilots requires an operating model that makes ownership, decisions, and delivery ways of working explicit. This section equips you to design how business, data, and IT collaborate to deliver AI outcomes reliably across a company. You’ll connect operating model patterns to portfolio and funding choices so AI strategy execution remains accountable and measurable.
Learning Objectives
-
Select an AI operating model pattern that fits organisational context and scale needs.
-
Define roles and decision rights across business, data, and IT for end-to-end AI delivery.
-
Structure AI initiatives and funding to sustain run/grow/transform value ownership.
-
-
Introduction
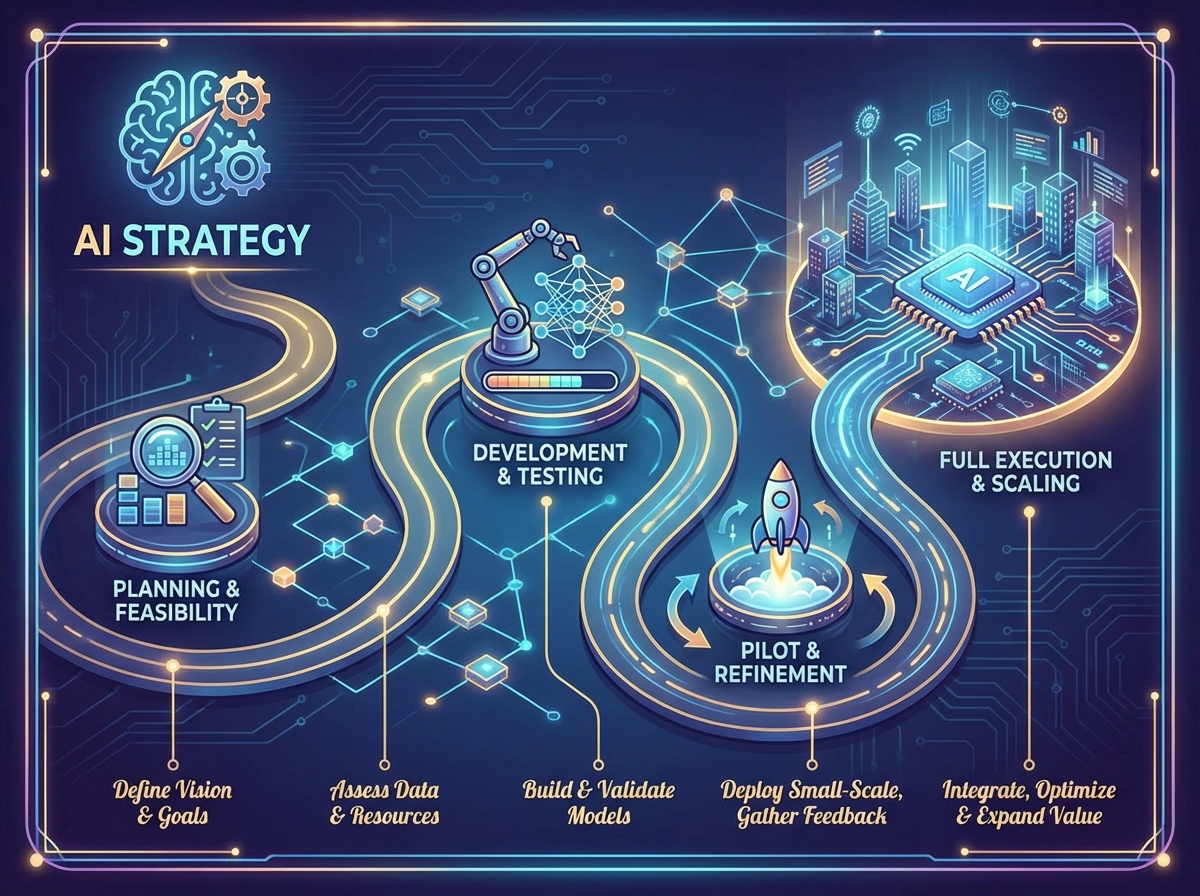
This section focuses on turning an AI strategy into an executable roadmap that delivers measurable business outcomes. You’ll learn how companies prioritise AI initiatives using value, feasibility, and risk lenses, then sequence work across horizons and dependencies. The emphasis is on practical execution: aligning executives, managing change impacts, and setting governance-ready commitments that support responsible AI delivery at scale.
Learning Objectives
-
Translate AI ambition into measurable business outcomes and success metrics suitable for portfolio governance.
-
Apply prioritisation methods that balance value, feasibility, and risk for AI initiatives.
-
Design an execution roadmap that sequences horizons, dependencies, and change impacts to enable delivery.
-
-
Introduction
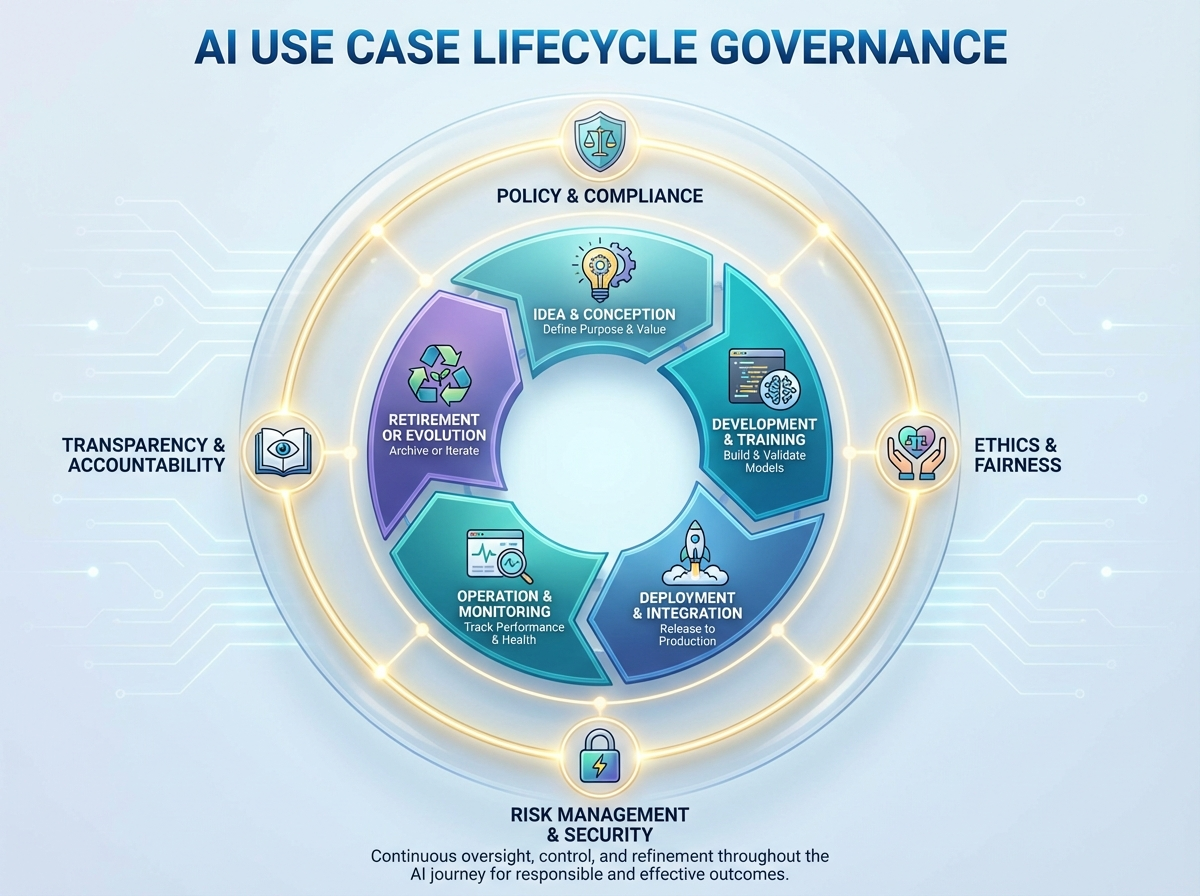
AI value at scale depends on consistent governance from intake to monitoring, not just model development. This section equips companies to standardise how use cases are proposed, approved, built, deployed, and managed over time. You’ll learn how to set stage gates, documentation expectations, and metrics so delivery teams can execute faster with clearer accountability. The focus is practical governance that supports strategy execution while managing risk across the AI lifecycle.
Learning Objectives
-
Define intake criteria and minimum evidence required to approve an AI use case for discovery.
-
Apply stage gates to make consistent decisions across discovery, build, deploy, and monitor phases.
-
Specify lifecycle documentation, KPIs, and ownership to ensure accountability and ongoing performance.
-
-
Introduction
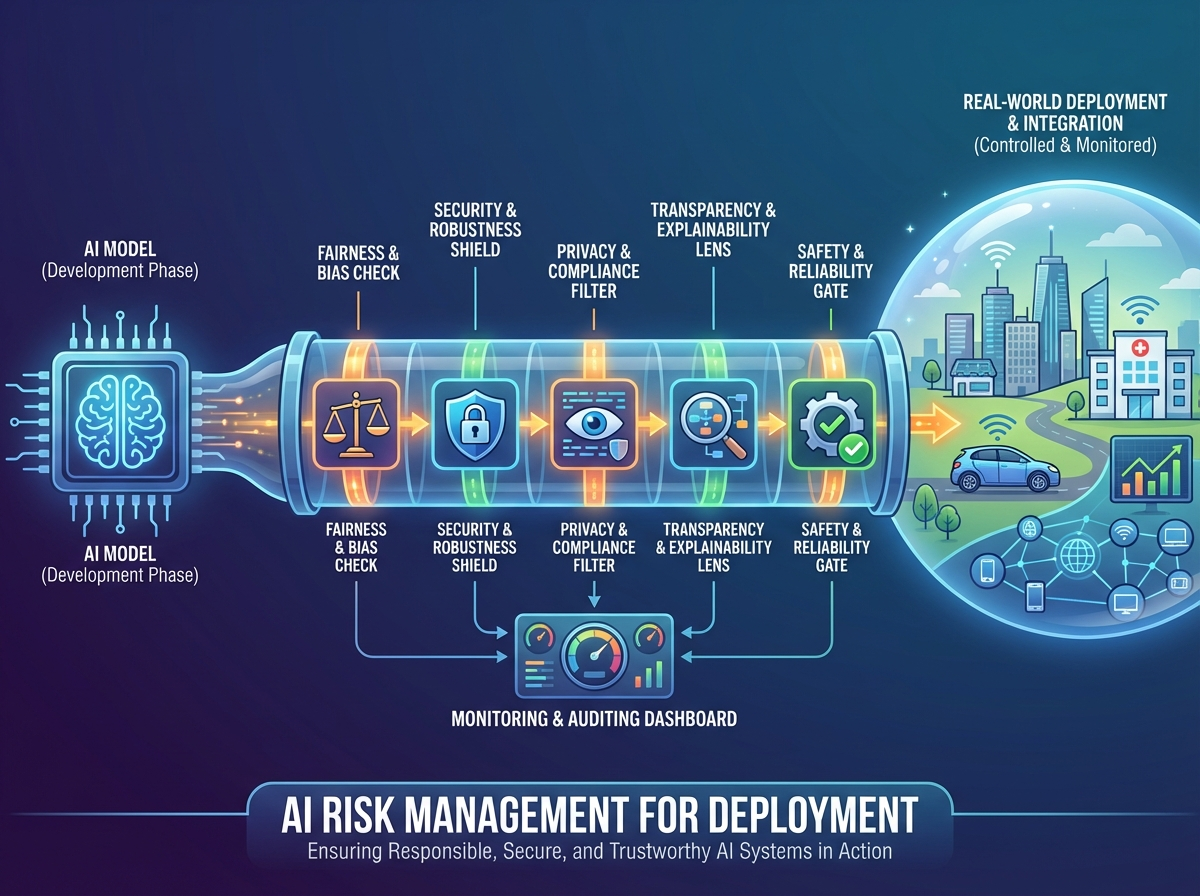
Deploying AI in a company shifts risk from theoretical concerns to operational realities that can impact customers, regulators, and business performance. This section equips you to identify and manage the core AI risks that typically emerge during deployment and scaling. You’ll learn how to assess model, data, and third-party risks and how to respond effectively when incidents occur in production.
Learning Objectives
-
Classify AI deployment risks across legal, ethical, safety, and operational categories to support consistent assessment.
-
Evaluate model and data risks (e.g., bias, drift, provenance, consent) to determine appropriate mitigations before and after launch.
-
Define third-party and incident response criteria to enable timely escalation and controlled remediation in production.
-
-
Introduction
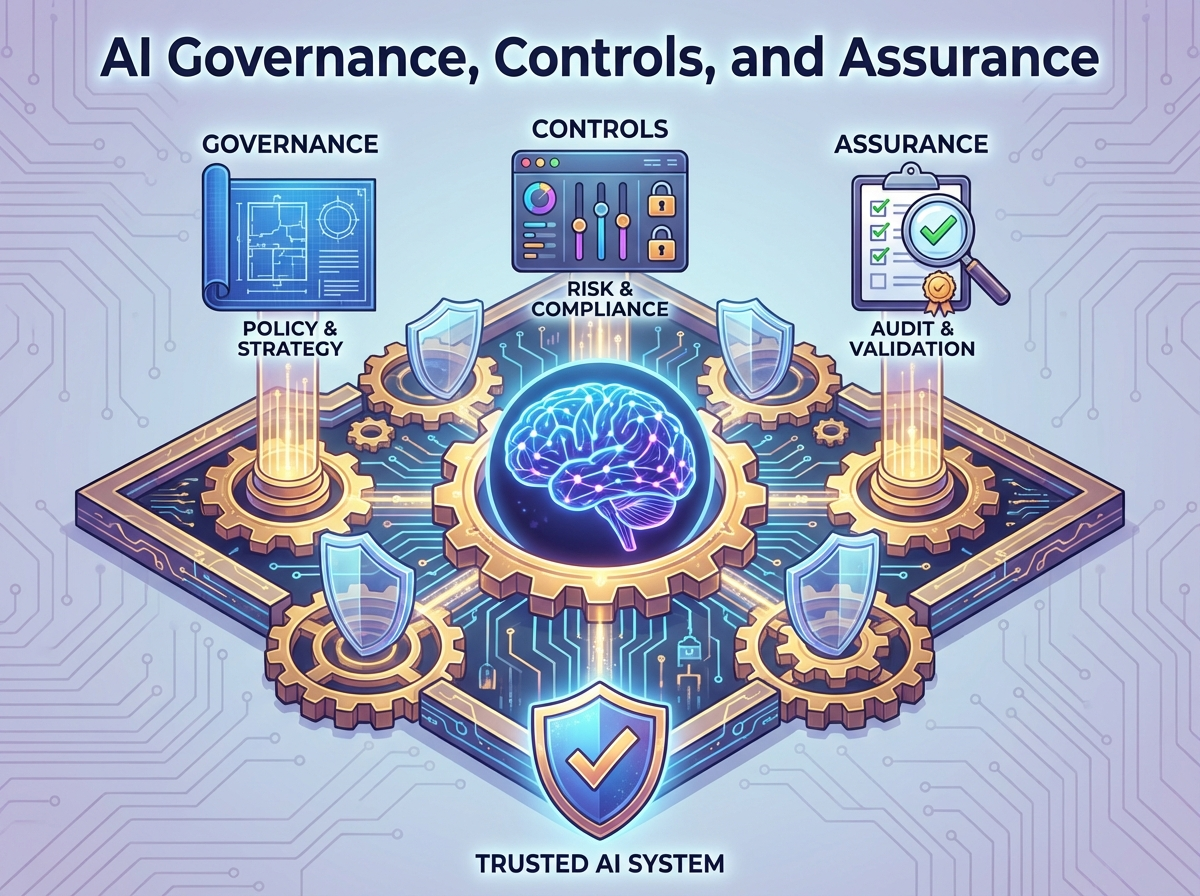
This section equips you to design AI governance that enables strategy execution while managing risk in real-world company environments. You’ll translate policy intent into practical controls, monitoring, and assurance evidence that supports safe deployment at scale. The focus is on making governance operational: measurable, auditable, and aligned to regulatory expectations and board oversight.
Learning Objectives
-
Define an AI governance framework that connects policies, standards, committees, and decision rights.
-
Design preventive, detective, and corrective controls across the AI lifecycle and operating model.
-
Specify monitoring and evidence requirements to support auditability, regulatory alignment, and board reporting.
-
-
Introduction
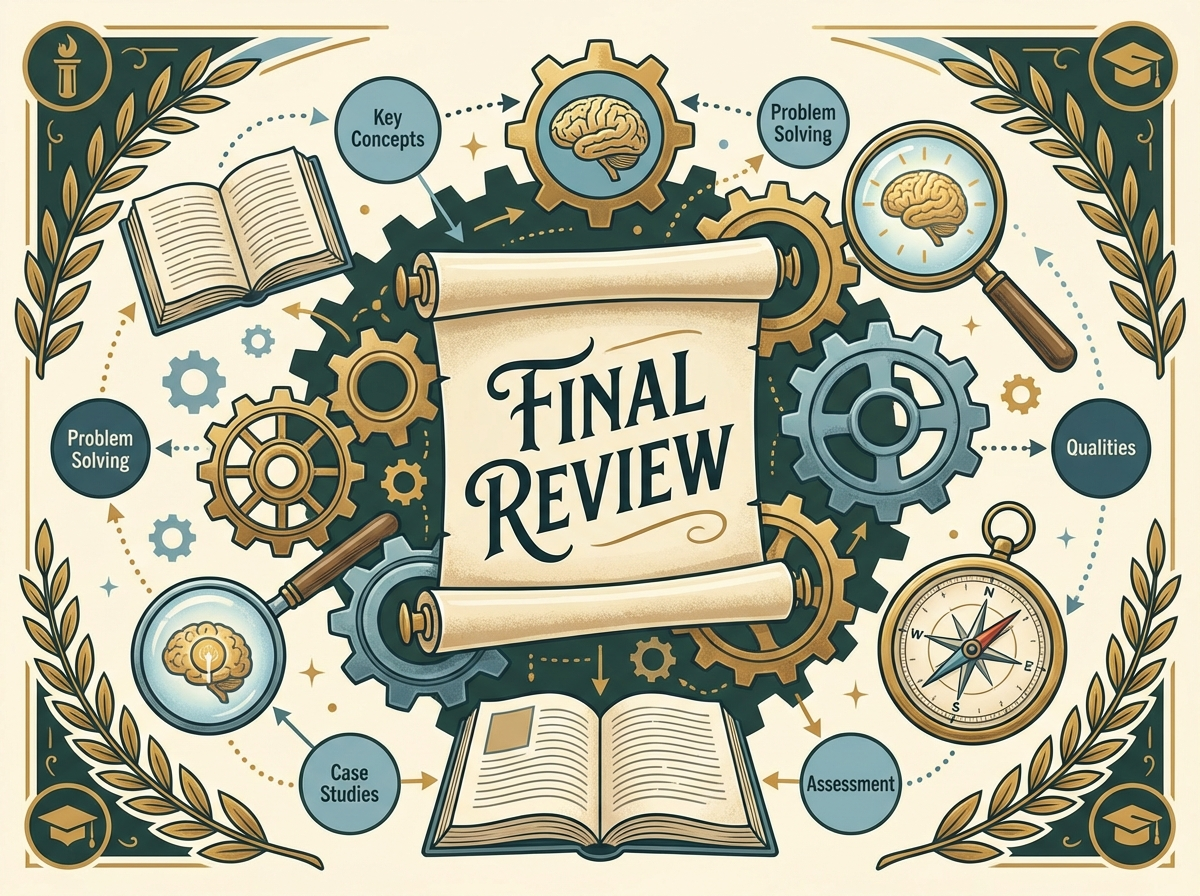
This section consolidates the operating model, execution roadmap, lifecycle governance, risk management, and assurance concepts into a coherent, practical view of building an AI-driven organisation. You will connect strategy to delivery and governance so AI initiatives can scale safely in real company environments. It also anchors how to sustain momentum by identifying next steps for capability building and continuous improvement.
Learning Objectives
-
Synthesize key concepts from operating model, execution, risk, and governance into an integrated approach.
-
Apply a structured self-assessment to identify gaps and priorities for improving AI strategy execution and controls.
-
Define actionable next learning and implementation steps to mature AI use cases and governance practices.
-